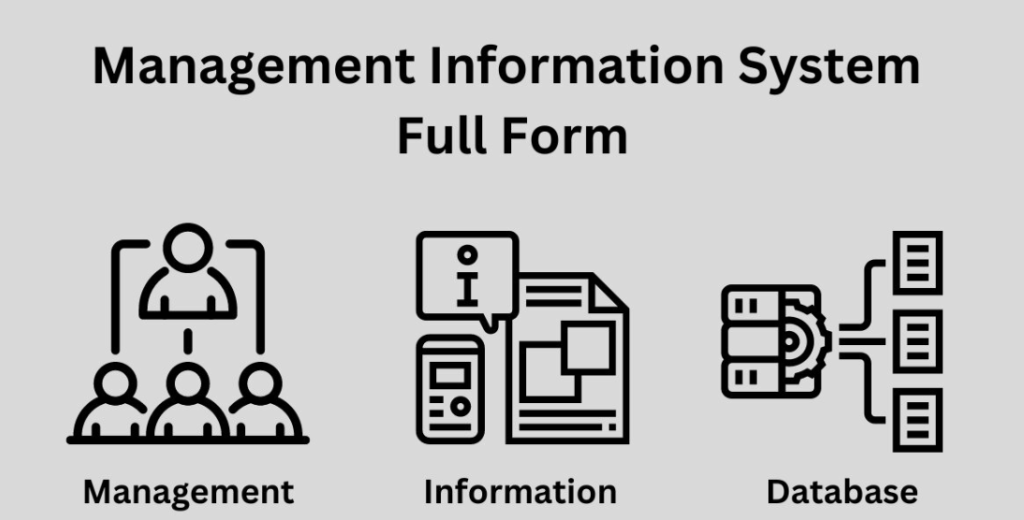
MIS report full form – Management Information System. It is a comprehensive system designed to gather, process, store, and disseminate information to support managerial decision-making within an organization. The primary goal of MIS is to provide managers at different levels with timely, accurate, and relevant information to facilitate effective planning, control, and decision-making processes.
OVERVIEW
In essence, MIS serves as a bridge between raw data and actionable insights, helping managers analyze trends, monitor performance, identify opportunities, and address challenges. By harnessing technology and various information systems, MIS integrates data from different sources across the organization and transforms it into meaningful reports, dashboards, and analytics that aid strategic and operational decision-making.
MIS encompasses various components, including hardware, software, databases, networks, and human resources, all working together to collect, process, and distribute information across the organization. It plays a crucial role in optimizing organizational efficiency, enhancing productivity, improving communication, and gaining a competitive edge in the market.
Overall, understanding the full form of MIS provides insight into its significance as a strategic tool for organizational management, enabling informed decision-making and driving business success.
MIS report
The format of a Management Information System (MIS) report may vary depending on the specific requirements of the organization and the nature of the data being presented. However, here is a general outline of the typical format of an MIS report:
Title: The report should have a clear and descriptive title that summarizes the content and purpose of the report.
Executive Summary: A brief overview of the key findings, insights, and recommendations presented in the report. This section provides a snapshot of the main points for busy executives who may not have time to read the entire report.
Introduction: An introduction to the report, providing background information on the topic, the scope of the report, and its objectives.
Data Sources: A description of the sources from which the data used in the report was collected, including internal systems, databases, surveys, or other sources.
Methodology: An explanation of the methods and techniques used to collect, analyze, and interpret the data presented in the report. This may include details on sampling methods, data collection tools, and analytical techniques.
Key Findings: A detailed presentation of the main findings and insights derived from the analysis of the data. This section should highlight important trends, patterns, and observations that are relevant to the objectives of the report.
Analysis: A deeper dive into the data, providing analysis and interpretation of the key findings. This section may include comparisons, trend analysis, variance analysis, and other analytical techniques to provide insights into the data.
Recommendations: Actionable recommendations based on the findings and analysis presented in the report. These recommendations should be specific, measurable, achievable, relevant, and time-bound (SMART) to guide decision-making and implementation.
Conclusion: A summary of the main points discussed in the report and any final thoughts or conclusions drawn from the analysis.
References: A list of sources cited or consulted in the preparation of the report, including data sources, research papers, articles, and other relevant literature.
Appendices: Additional supplementary materials, such as tables, charts, graphs, or raw data, that provide further detail or support for the findings and analysis presented in the report.
This format provides a structured framework for organizing and presenting the information in an MIS report, making it easy for readers to understand and interpret the data. Adjustments can be made to this format as needed to accommodate the specific requirements of the organization and the intended audience of the report.
MIS report format
The format of a Management Information System (MIS) report may vary depending on the specific requirements of the organization and the nature of the data being presented. However, here is a general outline of the typical format of an MIS report:
Title: The report should have a clear and descriptive title that summarizes the content and purpose of the report.
Executive Summary: A brief overview of the key findings, insights, and recommendations presented in the report. This section provides a snapshot of the main points for busy executives who may not have time to read the entire report.
Introduction: An introduction to the report, providing background information on the topic, the scope of the report, and its objectives.
Data Sources: A description of the sources from which the data used in the report was collected, including internal systems, databases, surveys, or other sources.
Methodology: An explanation of the methods and techniques used to collect, analyze, and interpret the data presented in the report. This may include details on sampling methods, data collection tools, and analytical techniques.
Key Findings: A detailed presentation of the main findings and insights derived from the analysis of the data. This section should highlight important trends, patterns, and observations that are relevant to the objectives of the report.
Analysis: A deeper dive into the data, providing analysis and interpretation of the key findings. This section may include comparisons, trend analysis, variance analysis, and other analytical techniques to provide insights into the data.
Recommendations: Actionable recommendations based on the findings and analysis presented in the report. These recommendations should be specific, measurable, achievable, relevant, and time-bound (SMART) to guide decision-making and implementation.
Conclusion: A summary of the main points discussed in the report and any final thoughts or conclusions drawn from the analysis.
References: A list of sources cited or consulted in the preparation of the report, including data sources, research papers, articles, and other relevant literature.
Appendices: Additional supplementary materials, such as tables, charts, graphs, or raw data, that provide further detail or support for the findings and analysis presented in the report.
This format provides a structured framework for organizing and presenting the information in an MIS report, making it easy for readers to understand and interpret the data. Adjustments can be made to this format as needed to accommodate the specific requirements of the organization and the intended audience of the report.
Types of MIS reports
Operational Reports: These reports provide detailed information on day-to-day operations within an organization. They include data on production output, sales figures, inventory levels, employee attendance, and other operational metrics. Operational reports help managers monitor performance, identify bottlenecks, and make adjustments to improve efficiency.
Financial Reports: Financial reports present data related to the financial health of the organization. They include income statements, balance sheets, cash flow statements, budget variance reports, and other financial metrics. Financial reports help managers assess profitability, liquidity, solvency, and overall financial performance.
Management Reports: Management reports provide summarized information tailored to the needs of senior management. They include key performance indicators (KPIs), strategic metrics, and high-level summaries of operational and financial performance. Management reports help executives monitor progress towards strategic goals, make informed decisions, and allocate resources effectively.
Executive Dashboards: Executive dashboards are graphical representations of key performance indicators (KPIs) and other relevant metrics displayed in real-time or near-real-time. They provide executives with a visual overview of organizational performance, allowing them to quickly identify trends, patterns, and areas requiring attention. Executive dashboards often include interactive features that enable users to drill down into the data for more detailed analysis.
Ad Hoc Reports: Ad hoc reports are customized reports generated in response to specific inquiries or requests from management. They are typically created on an as-needed basis and may include data from multiple sources or databases. Ad hoc reports help managers gain insights into specific issues, trends, or questions that arise during the course of operations.
Analytical Reports: Analytical reports focus on in-depth analysis of data to uncover insights, trends, and patterns. They often involve complex statistical analysis, data mining, or predictive modeling techniques to identify correlations, causal relationships, or predictive trends. Analytical reports help managers understand the underlying factors driving performance and make informed decisions based on data-driven insights.
These types of MIS reports serve different purposes and cater to the needs of various levels of management within an organization. By providing timely, accurate, and relevant information, MIS reports empower managers to make informed decisions, monitor performance, and drive organizational success.
MIS report analysis
MIS report analysis refers to the process of examining and interpreting the data presented in Management Information System (MIS) reports to derive meaningful insights and make informed decisions. It involves analyzing various aspects of the data, including trends, patterns, correlations, and anomalies, to understand the underlying factors driving organizational performance.
The analysis of MIS reports typically involves several key steps:
Data Review: Reviewing the data presented in the MIS reports to gain an understanding of the information available and its relevance to the objectives of the analysis.
Identification of Key Metrics: Identifying key performance indicators (KPIs) and other relevant metrics to focus the analysis on areas of interest or concern.
Trend Analysis: Examining historical data to identify trends and patterns over time. This may involve visualizing the data using charts, graphs, or other graphical representations to identify trends, cycles, or seasonal variations.
Variance Analysis: Comparing actual performance against predetermined benchmarks, targets, or historical averages to identify variances and deviations. This helps in understanding the reasons behind the variations and taking corrective actions as necessary.
Root Cause Analysis: Investigating the underlying factors contributing to performance trends or variances to identify root causes and address underlying issues.
Comparative Analysis: Comparing performance across different departments, regions, products, or time periods to identify areas of strength, weakness, or opportunity.
Predictive Analysis: Using statistical techniques, data mining, or predictive modeling to forecast future performance based on historical data and trends. This helps in anticipating future challenges and opportunities and planning accordingly.
Scenario Analysis: Evaluating different scenarios or hypothetical situations to assess their potential impact on organizational performance. This helps in making informed decisions and developing contingency plans.
Actionable Insights: Summarizing the analysis findings and deriving actionable insights and recommendations for management consideration. These insights help in guiding decision-making and driving performance improvement initiatives.
Overall, MIS report analysis plays a crucial role in leveraging the information contained in MIS reports to support strategic and operational decision-making within an organization. By analyzing data effectively, managers can gain valuable insights, identify opportunities for improvement, and drive organizational success.
MIS reporting tools
Management Information System (MIS) reporting tools are software applications or platforms used to collect, process, analyze, and present data for managerial decision-making. These tools automate the process of generating reports, making it easier for organizations to access timely and accurate information to support strategic and operational decision-making.
Here are some common MIS reporting tools used by organizations:
Business Intelligence (BI) Platforms: BI platforms such as Tableau, Power BI, and QlikView allow organizations to create interactive dashboards, reports, and visualizations from multiple data sources. These tools provide advanced analytics capabilities, including data visualization, ad hoc querying, and predictive analytics.
Enterprise Resource Planning (ERP) Systems: ERP systems like SAP, Oracle ERP, and Microsoft Dynamics include built-in reporting modules that allow organizations to generate standard and customized reports from their enterprise-wide data. These tools integrate data from different business functions, such as finance, sales, procurement, and human resources, to provide a comprehensive view of organizational performance.
Customer Relationship Management (CRM) Software: CRM software such as Salesforce, HubSpot, and Zoho CRM include reporting features that allow organizations to track sales performance, customer interactions, and marketing campaigns. These tools provide insights into customer behavior, preferences, and trends to inform sales and marketing strategies.
Database Management Systems (DBMS): DBMS such as MySQL, Microsoft SQL Server, and Oracle Database include reporting capabilities that allow organizations to query, analyze, and visualize data stored in databases. These tools are commonly used to create operational reports, ad hoc queries, and data exports for analysis.
Spreadsheet Software: Spreadsheet software such as Microsoft Excel and Google Sheets are widely used for basic reporting and analysis tasks. Organizations use spreadsheets to create simple reports, perform data analysis, and share information with stakeholders. Advanced users can leverage Excel’s features such as pivot tables, macros, and add-ins for more sophisticated reporting and analysis.
Data Visualization Tools: Data visualization tools such as Domo, Looker, and Dundas BI specialize in creating interactive visualizations and dashboards from complex datasets. These tools help organizations communicate insights effectively and facilitate data-driven decision-making.
Reporting APIs: Reporting APIs (Application Programming Interfaces) allow organizations to integrate reporting functionality into custom applications or software solutions. These APIs provide programmatic access to reporting features, allowing developers to create customized reports tailored to specific business needs.
ICAI full form is The Institue of Chartered Accountants of India. ICAI Full Form is The Institue of Chartered Accountants of India. ICAI Full Form . ICAI Full Form . ICAI Full Form . ICAI Full Form. ICAI Full Form
FAQ
MIS reporting refers to the process of collecting, analyzing, and presenting data to support managerial decision-making within an organization. It involves generating reports that provide insights into various aspects of organizational performance, such as sales, operations, finance, and customer relations.
MIS reporting is important because it helps managers monitor performance, identify trends, and make informed decisions based on accurate and timely information. It provides a comprehensive view of organizational activities and enables managers to track progress towards goals, allocate resources effectively, and identify areas for improvement.
MIS reports may include a wide range of data, including financial metrics, operational statistics, sales figures, customer feedback, employee performance indicators, and market trends. The specific types of data included in MIS reports depend on the objectives of the reporting process and the needs of the organization.
Related posts:
- AMC Full Form: Benefits, Components, Needs, Advantage
- ORS Full Form: Dehydration, Myths, Flavors, Varieties & Facts
- PCC Full Form: Importance, Types, Application Process
- PAN Full Form: Legal Provisions, Regulations,
- BRB Full Form: Productive, Routine, Distractions
- MCD Full From: Introduction, Responsibility, Challenges
- CT Scan Full Form: Scans, price, Advantages
- USA Full Form: History, Economics,Technology, culture